USE OF GOOGLE DATA STUDIO FOR CAMPAIGN REPORTING
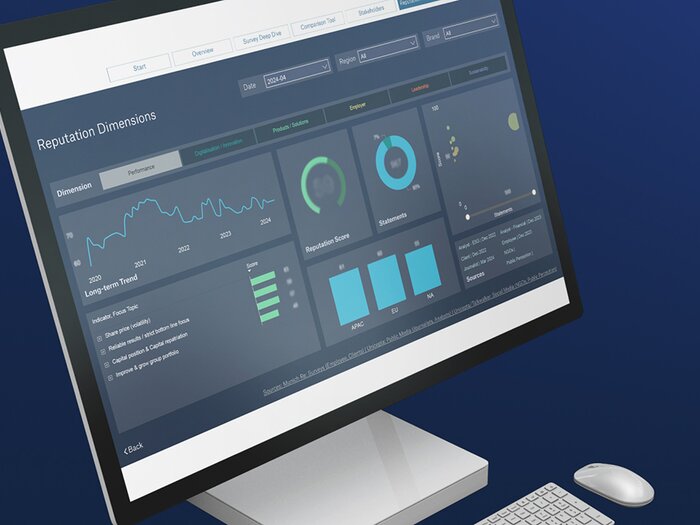
To visualise the international campaign performance across 15 countries, clear and meaningful standard reports were to be generated on behalf of the client. The primary objective was the comparability of the individual countries in the registration funnel. In addition to display, SEA, SEO, YouTube and affiliate data, the website performance was also to be analysed.
The data had to be automatically updated in the form of dynamic reports and allow views to be filtered interactively on an individual user basis. The aggregation of campaign and CRM data was also required for a holistic view.
TURNING DATA INTO FACTS
In order to be able to realise these customer requirements, netzeffekt needed not only the appropriate access to the original tools of the data sources (campaigns, website, external sources, etc.) but also appealing forms of visualisation.
As Google products were already in use for campaign management and website evaluation, it was obvious to use a Google tool for data visualisation as well: With Google Data Studio, various data sources could be aggregated via numerous interfaces and made available as an individualised dashboard within a very short time.
HARD FACTS! - BUT made visual
- Successful utilisation of the tools already in use
- Preparation of all collected campaign performance data
- Dynamic, user-based reporting
- Cross-data, fast and appealing visualisation
Jenny Ruhland, Consultant Web Analytics


